Most owners can tell you roughly what they made last month. Far fewer can tell you which customer it came from, which product carried it, or what it cost to earn. These two reports answer that, and they're most useful read as a pair: Sales is what's coming in, Expenses is what's going out, and the gap is what the business actually earns.
They're also the two reports that change behaviour fastest. A concentration risk you can see is a concentration risk you can do something about; a subscription you'd forgotten stays forgotten until it shows up in a category total.
What to know before you trust the totals
- Sales is invoiced revenue, not money received. A strong Sales report alongside an empty bank account is a collections problem, not a sales one — see Track & chase unpaid invoices or the Cash Flow report.
- Nothing unrecorded appears. Sales is built from invoices raised in stub, income added manually, connected payment providers and bank transactions categorised as income. Expenses is built from categorised transactions — categorise first, see Categorise bank transactions. Uncategorised transactions are the usual reason a total looks too low.
- Big purchases aren't expenses. A laptop, vehicle or machine keeps its value and earns for years, so it appears only as depreciation — the slice written off each period. See Calculate & record depreciation.
- VAT sits elsewhere. Expense amounts exclude VAT; VAT you've paid stays under Liabilities until you claim it back.
- Every total opens onto its transactions, so an odd month can be checked for wrong dates, duplicates or mis-categorised entries rather than guessed at.
What the Sales report answers
Go to Reports in the sidebar and pick Sales — or, from any report, click its name at the top and choose Sales from the dropdown. The selector at the top switches the view between Customers, Categories and Products.
- Who your business actually depends on. Sales by customer usually shows a handful of names carrying the rest. That's who to look after — and a concentration risk worth knowing about before you lose one.
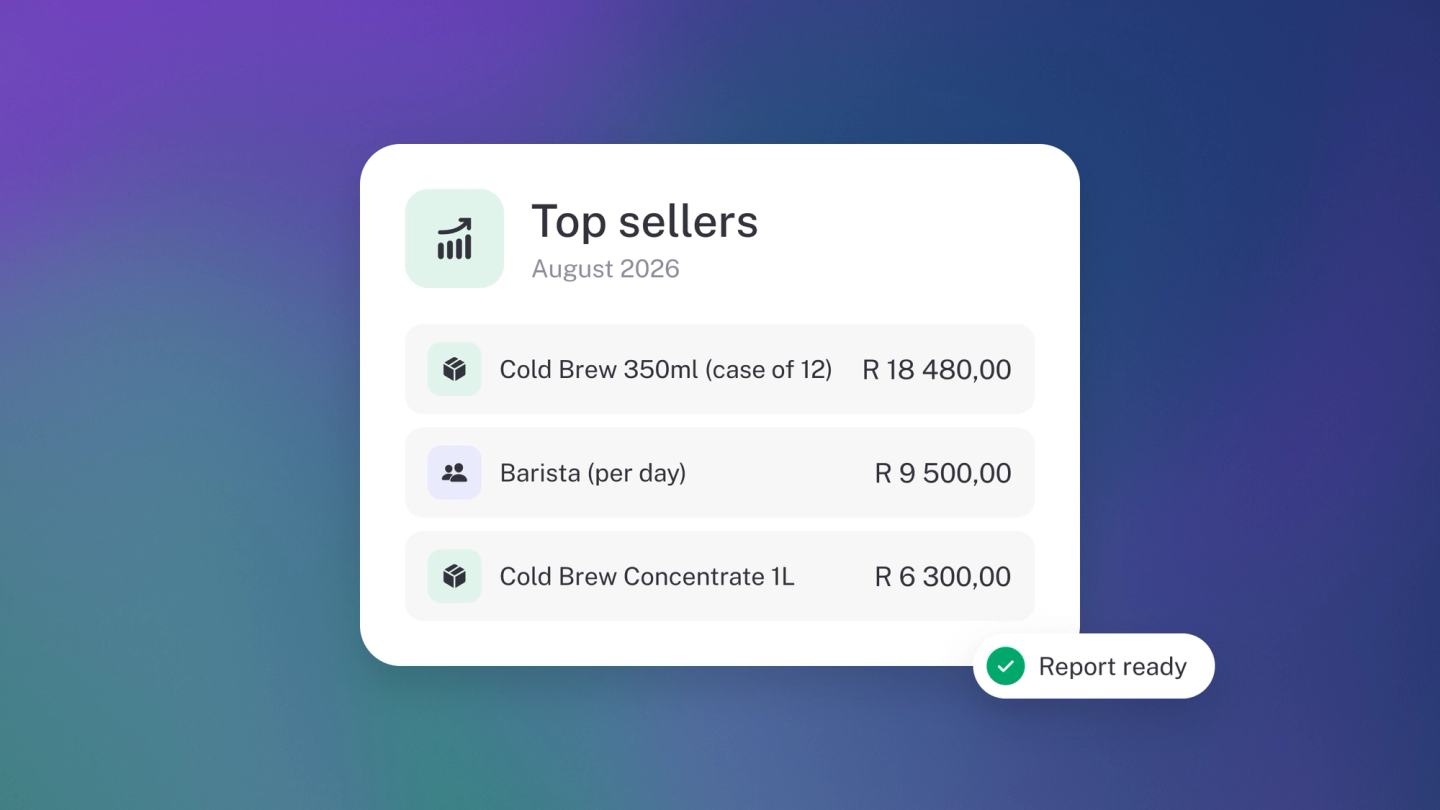
- What's genuinely selling. Sales by product or service separates what you talk about from what people buy. Useful before you build more of something, or quietly retire it.
- Whether you're growing or just busy. Sales over time shows the shape — steady, seasonal, or drifting down while the workload stays the same.
- Where a number came from. Open any total to see the transactions behind it.
Use the Tag filter in the header — or Compare → By tag for a column per tag — to answer the same questions per project, campaign or region. See Create & manage tags.
What the Expenses report answers
Open the same dropdown and choose Expenses; its selector switches between Categories and Suppliers.
- What the business costs to run. Total expenses for a normal month is the number to compare every pricing decision against.
- Which costs crept up. Expenses by category — rent, software, travel, supplies — is where subscriptions and small recurring charges become visible.
- Where your money concentrates. Expenses by supplier shows who gets the biggest share, which is where negotiating actually pays off.
- What to trim. You can't cut what you can't see; open a category or supplier to review the individual expenses and dates behind it.
Reading them together
Sales tells you what's coming in, Expenses what's going out; the gap is what the business actually earns. A customer that looks like your best on the Sales report can be your worst once the cost of serving them shows up in Expenses. Same period, both reports, then decide.
Export either one
Click the ··· menu → Download → CSV or PDF when an accountant or lender asks — see Export & share a report.