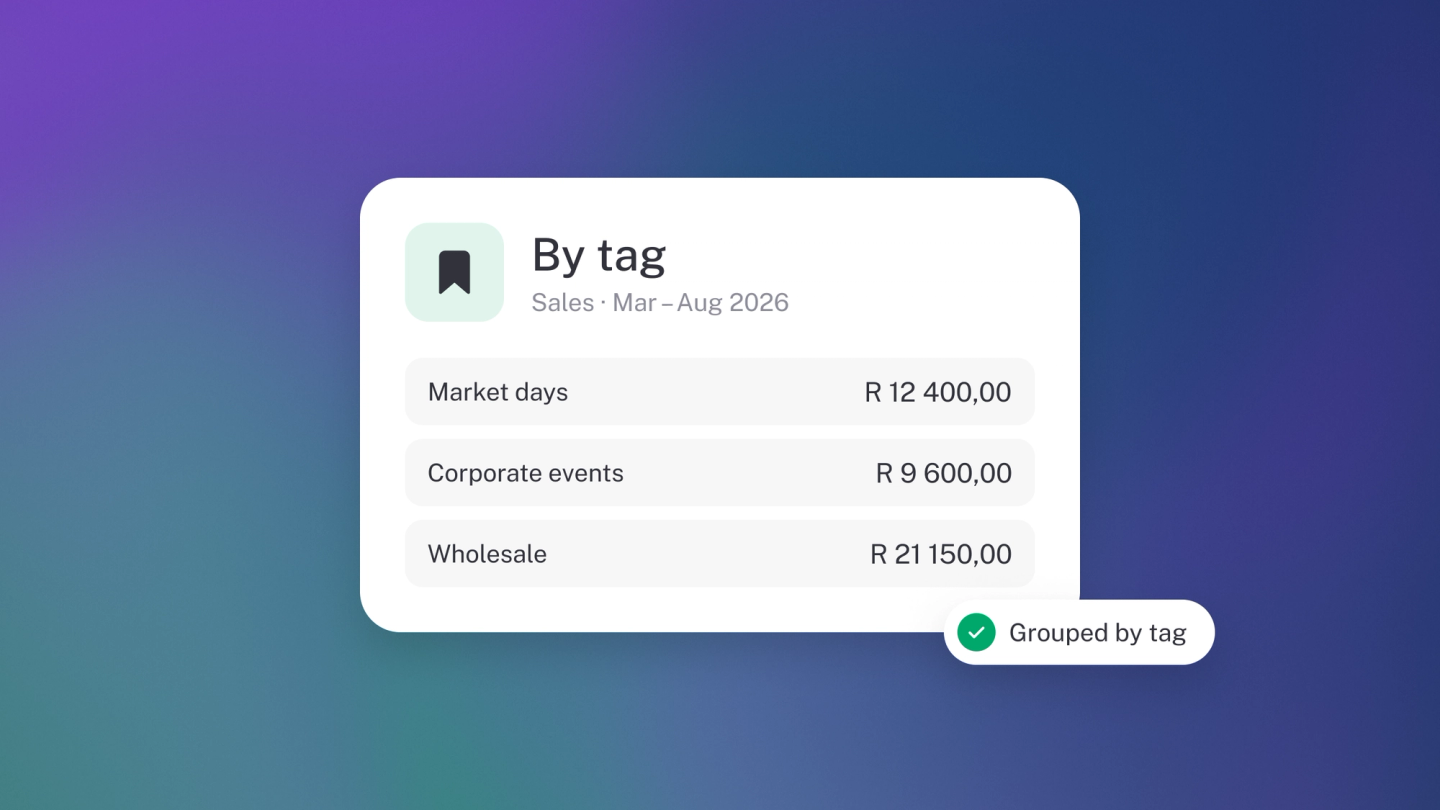
Most businesses know their overall profit and almost nothing about its composition. The average hides everything that matters: the client who looks big and is barely breaking even, the branch quietly carrying the others, the campaign that spent more than it brought in. Splitting a report by tag is how you get from "we made money this quarter" to "we made money on these three jobs, in spite of that one."
That's a question you can't answer retroactively. Tag as you go and the answer is a click away for any period; leave it and the information is gone.
What to know first
- The report only shows what was tagged. If a project looks emptier than it should, its invoices and bills are untagged — that's the fix, not the report.
- Tag both sides or the answer is misleading. A job tagged on its invoices but not its bills will look far more profitable than it is. Costs need the same tag as the revenue.
- By tag and the Tag filter are opposites. Compare → By tag splits the report into a column per tag; the Tag filter narrows the whole report to one. The filter is hidden while you're in By tag mode, because the split has already happened.
- By tag only appears once tags exist — if you can't see the option, you haven't created any tags yet. And it isn't on every report: Profit & Loss, Sales and Expenses offer the column split; other reports, like Cash Flow, carry the Tag filter only.
- Consistency beats coverage. Three spellings of the same branch give you three half-answers — see Create & manage tags.
Before you start
Set up your tags and put them on your records. See Create & manage tags.
Split a report by tag
Go to Reports in the sidebar and pick Profit & Loss (or Sales, or Expenses). Set your period, then choose By tag in the Compare selector.
You get a column per tag, side by side. One glance tells you which project carried the month and which one ate it.
Look at one tag on its own
Use the Tag filter in the report header and pick the tag. Everything on the report now covers only records carrying that tag.
What to use it for
- Project or client profitability. Tag every invoice and every bill for a job with the same tag. Your Profit & Loss then shows exactly what that job earned and what it cost.
- Branch or location. Tag by site and compare them against each other.
- Campaign returns. Tag your advertising spend and the sales that came from it, and see whether the campaign paid for itself.
Download it
Click ··· → Download, pick PDF or CSV and download — the details are in Export & share a report.
Tip: Combine a tag with a date range. Set the period to the quarter, filter to the project, and you have that project's quarterly performance in two clicks.